Amity University Noida-B.Tech Admissions 2026
Among top 100 Universities Globally in the Times Higher Education (THE) Interdisciplinary Science Rankings 2026


Probability JEE Main Questions: Probability is a significant chapter of JEE Main Mathematics and is known for being a scoring chapter if the concepts are clear. The exam typically contains questions on such topics as conditional probability, Bayes’ theorem, random variables, mean, and variance. Practicing Probability JEE Main 2027 questions is important because it helps students understand the exam pattern, improve problem-solving skills, and strengthen conceptual clarity. In this article, students can find Probability JEE Main previous year questions with solutions to enhance their preparation for the examination.
This Story also Contains

Probability in JEE Main 2027 is a part of many concepts that require technical reasoning and knowledge of mathematics. These questions are designed to check how to apply formulas and solve questions. The following are some main topics of Probability JEE Main questions with solutions asked in previous years:
|
Topic |
Key Focus Area |
|
Basic definitions: experiment, outcome, sample space, event | |
|
Union, intersection, complement, Venn diagram representation | |
|
Laws of probability, mutually exclusive & exhaustive events | |
|
Formulas, proof, applications | |
|
Definition, examples, and difference from mutually exclusive events | |
|
Conditional Probability: Definition, Formula, Properties, and Examples |
Definition, formula, properties, solved examples |
|
Applications in problem-solving, real-life probability questions | |
|
Discrete random variables, mean & variance | |
|
Properties, probability mass function, examples |
Get expert advice on college selection, admission chances, and career path in a personalized counselling session.
Solving previous year questions from probability is one of the best ways to prepare for the JEE Main exam. These questions help you to understand the exam pattern and the types of questions asked. Given below are some previous year questions of JEE Main from Probability:
Question: A bag contains $(\mathrm{N}+1)$ coins - N fair coins, and one coin with 'Head' on both sides. A coin is selected at random and tossed. If the probability of getting 'Head' is $\frac{9}{16}$, then N is equal to:
(1) 5
(2) 7
(3) 8
(4) 9
Solution:
Total ( $\mathrm{N}+1$ ) coins
$\mathrm{N} \Rightarrow$ fair coins
$1 \Rightarrow$ Head on both side
$\begin{aligned}
& P\left(1^{+}\right)=\left(\frac{N}{N+1}\right)\left(\frac{1}{2}\right)+\left(\frac{1}{N+1}\right) 1 \\
& =\frac{N+2}{2(N+1)}=\frac{9}{16} \\
& 8 N+16=9 N+9 \\
& \Rightarrow N=7
\end{aligned}$
Question: If $A$ and $B$ are two events such that $\mathrm{P}(\mathrm{A})=0.7$, $\mathrm{P}(\mathrm{B})=0.4$ and $\mathrm{P}(\mathrm{A} \cap \overline{\mathrm{B}})=0.5$, where $\overline{\mathrm{B}}$ denotes the complement of $B$, then $P(B \mid(A \cup \bar{B}))$ is equal:-
(1) $\frac{1}{4}$
(2)$\frac{1}{2}$
(3) $\frac{1}{6}$
(4) $\frac{1}{3}$
Solution:
$\begin{aligned} & P(A)=0.7 \\ & P(B)=0.4 \\ & P\left(A \cap B^C\right)=0.5\end{aligned}$
$\begin{aligned}
& P\left(B / A \cup B^C\right)=\frac{P\left(B \cap\left(A \cup B^C\right)\right)}{P\left(A \cup B^C\right)} \\
& =\frac{P(A \cap B)}{P\left(A \cup B^C\right)}
\end{aligned}$
Using Venn diagram
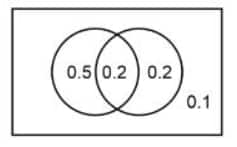
$\Rightarrow \quad \frac{P(A \cap B)}{P\left(A \cup B^C\right)}=\frac{0.2}{0.5+0.2+0.1}=\frac{2}{8}=\frac{1}{4}$
Hence, the answer is option (1).
Question: A card from a pack of 52 cards is lost. From the remaining 51 cards, $n$ cards are drawn and are found to be spades. If the probability of the lost card to be a spade is $\frac{11}{50}$, the n is equal to
(1) 1
(2) 2
(3) 4
(4) 5
Solution:
Let the event $L$ be: "Lost card is a spade"
Let the event $D$ be: "All $n$ drawn cards are spades"
We are given:
$
P(L \mid D) = \frac{11}{50}
$
We will use Bayes' Theorem:
$
P(L \mid D) = \frac{P(D \mid L) \cdot P(L)}{P(D)}
$
First, compute the prior probabilities:
Number of spades in a full deck = 13
Probability that the lost card is a spade:
$
P(L) = \frac{13}{52} = \frac{1}{4}
$
Probability that the lost card is not a spade:
$
P(L') = \frac{39}{52} = \frac{3}{4}
$
Now calculate: If the lost card is a spade, then the number of spades left = $13 - 1 = 12$, and the total cards left = 51.
So, $
P(D \mid L) = \frac{{^{12}C_n}}{{^{51}C_n}}
$
If the lost card is not a spade, then all 13 spades are still there.
So, $
P(D \mid L') = \frac{{^{13}C_n}}{{^{51}C_n}}
$
Now apply Bayes' Theorem:
$
\frac{11}{50} = \frac{\frac{{^{12}C_n}}{{^{51}C_n}} \cdot \frac{1}{4}}{\frac{{^{12}C_n}}{{^{51}C_n}} \cdot \frac{1}{4} + \frac{{^{13}C_n}}{{^{51}C_n}} \cdot \frac{3}{4}}
$
Cancel common factor ${^{51}C_n}$ in numerator and denominator:
$
\frac{11}{50} = \frac{{^{12}C_n} \cdot \frac{1}{4}}{{^{12}C_n} \cdot \frac{1}{4} + {^{13}C_n} \cdot \frac{3}{4}}
$
Multiply numerator and denominator by 4:
$
\frac{11}{50} = \frac{{^{12}C_n}}{{^{12}C_n} + 3 \cdot {^{13}C_n}}
$
Now, cross-multiply:
$
11 \left( {^{12}C_n} + 3 \cdot {^{13}C_n} \right) = 50 \cdot {^{12}C_n}
$
$
11 \cdot {^{12}C_n} + 33 \cdot {^{13}C_n} = 50 \cdot {^{12}C_n}
$
$
33 \cdot {^{13}C_n} = 39 \cdot {^{12}C_n}
$
Divide both sides by 3: $
11 \cdot {^{13}C_n} = 13 \cdot {^{12}C_n}
$
Use identity: $
{^{13}C_n} = \frac{13}{13 - n} \cdot {^{12}C_n}
$
So: $
11 \cdot \frac{13}{13 - n} \cdot {^{12}C_n} = 13 \cdot {^{12}C_n}
$
Cancel ${^{12}C_n}$: $
\frac{143}{13 - n} = 13
$
Now solve: $
143 = 13 \cdot (13 - n)
$
$
143 = 169 - 13n
$
$
13n = 169 - 143 = 26
$
$n = 2$
Hence, the answer is option (2).
Question: If the probability that the random variable X takes the value x is given by $\mathrm{P}(\mathrm{X}=\mathrm{x})=\mathrm{k}(\mathrm{x}+1) 3^{-x}$, $\mathrm{x}=0,1,2,3 \ldots \ldots$., where k is a constant, then $\mathrm{P}(\mathrm{X} \geq 3)$ is equal to
(1) $\frac{7}{27}$
(2) $\frac{4}{9}$
(3) $\frac{8}{27}$
(4) $\frac{1}{9}$
Solution:
$s = \frac{k}{3^0} + \frac{2k}{3} + \frac{3k}{3^2} + \ldots$
Dividing both sides by 3,
$\frac{s}{3} = \frac{k}{3} + \frac{2k}{3^2} + \frac{3k}{3^3} + \ldots$
Subtracting,
$s - \frac{s}{3} = k + \frac{k}{3} + \frac{k}{3^2} + \ldots$
The right side is a geometric series with sum
$k \times \frac{1}{1 - \frac{1}{3}} = \frac{3k}{2}$
Thus,
$\frac{2s}{3} = \frac{3k}{2} \implies s = \frac{9k}{4}$
Since total probability $s=1$,
$\frac{9k}{4} = 1 \implies k = \frac{4}{9}$
Now, calculate $P(x \geq 3)$:
$P(x \geq 3) = 1 - \left(P(x=0) + P(x=1) + P(x=2)\right)$
$1 - \left(k + \frac{2k}{3} + \frac{3k}{3^2}\right) = 1 - 2k$
$= 1 - 2 \times \frac{4}{9}$
$= \frac{1}{9}$
Hence, the correct answer is option (4).
Question: One die has two faces marked 1, two faces marked 2, one face marked 3, and one face marked 4. Another die has one face marked 1, two faces marked 2, two faces marked 3, and one face marked 4. The probability of getting the sum of numbers to be 4 or 5, when both dice are thrown together, is:
(1) $\frac{1}{2}$
(2) $\frac{3}{5}$
(3) $\frac{2}{3}$
(4) $\frac{4}{9}$
Solution:
Dice 1 : 1, 1, 2, 2, 3, 4
Dice 2 : 1, 2, 2, 3, 3, 4
For Sum $=4$
$
\begin{aligned}
& (1,3) \Rightarrow 2 \times 2=4 \\
& (3,1) \Rightarrow 1 \times 1=1 \\
& (2,2) \Rightarrow 2 \times 2=4
\end{aligned}
$
Total ways $=9$
$
\text { Sum = } 5
$
$
\begin{aligned}
& (1,4) \Rightarrow 2 \times 1=2 \\
& (4,1) \Rightarrow 1 \times 1=1 \\
& (2,3) \Rightarrow 2 \times 2=4 \\
& (3,2) \Rightarrow 1 \times 2=2
\end{aligned}
$
Total ways $=9$
$
\text { Probability }=\frac{18}{36}=\frac{1}{2}
$
Hence, the correct answer is option (1).
Probability is an important part of JEE Main math because questions from this chapter come every year in the exam. If the basics from this chapter are well prepared, then it is an easy and scoring chapter that will help you improve your overall marks. Given below are some points on why this chapter is important for the JEE Main exam:
1. This chapter is less time-consuming and can be covered with proper efficiency and attention.
2. Every year, this chapter has a significant amount of weightage associated with it. Probability JEE Mains questions with solutions can increase your rank too if studied properly.
3. In JEE Advanced, it has core importance, as this forms the base of mathematical reasoning.
4. Probability JEE Mains weightage is approximately 6.32%, which cannot be ignored.
Learn the formulas first, but don't stop there — understand where each formula comes from. A formula you've only memorized will fail you the moment a question is slightly rephrased.
Solve the previous 10 years' PYQs before anything else. Not after finishing the chapter while you're studying it. JEE Main repeats question types more often than it repeats questions, and spotting those patterns early changes how you prioritize your time.
Don't stay in your comfort zone with easy problems. Moderate and difficult questions are where marks are actually won or lost. If you're only solving textbook exercises, you're not testing yourself against what the paper actually looks like.
Take chapter-wise mock tests before moving on. Finishing the chapter isn't the same as being ready to answer questions from it under time pressure.
Revise your short notes every week, not the night before the exam. Probability has enough interconnected concepts—conditional probability feeding into Bayes, random variables feeding into distributions—that weekly revision keeps the whole picture intact.
Frequently Asked Questions (FAQs)
Yes. It typically accounts for around 5–7% of the Mathematics section and is one of the more scoring chapters if you've done the groundwork.
Not optional — do them. PYQs tell you exactly what the paper tests and how it tests it.
Conditional Probabilities, Bayes' Theorem, Random Variables, and Binomial Distributions. These four appear many times more than the others.
Most fall in the moderate range. The ones that feel hard are usually Bayes' Theorem or distribution-based problems — both become manageable with enough practice.
NCERT for concepts. RD Sharma or Cengage Mathematics for problem variety. Arihant's Skills in Mathematics, if you want, focused practice on this chapter specifically.
Yes, at the very least, formula revision, concept distillation, and daily applications of the concepts for 7 days are enough to teach a chapter well.
Yes. The Advanced paper pushes the same concepts further — more complex setups, longer problems. A strong JEE Main-level foundation makes Advanced preparation significantly easier.

On Question asked by student community
Hello Dear Student,
With an 81 percentile in MHT CET and 71 percentile in JEE Main as a Female VJNT candidate, securing Computer Engineering, CSE, or IT in top-tier colleges (like VJTI or COEP) is difficult through CAP rounds. However, your category benefits and All India Rank provide strong prospects
Hello,
For JEE Advanced Physics preparation, focus on building strong conceptual understanding along with regular problem-solving. Important topics include:
Mechanics
Electrostatics and Current Electricity
Magnetism
Electromagnetic Induction
Optics
Modern Physics
Thermodynamics
Waves and Oscillations
Rotational Motion
Fluid Mechanics
You can prepare using NCERT, H.C. Verma, D.C. Pandey, and previous years'
Hello, if you entered the wrong JEE percentile but uploaded the correct JEE scorecard, your application may still be considered during document verification. However, the final decision will depend on BBAU's verification process. It is advisable to contact the university admission office and inform them about the mistake as soon
Hello Aspirant,
With JEE main rank of 8,19,756 General (Delhi) Category and 68% in class 12 getting CSC or it in top IPU colleges like BPIT, VIPS, BVCOE, Akhilesh Das, or HMRITM is unlikely through the regular counselling rounds.
However, you should still participate in all IPU counselling rounds including
Hello! Thank you for your question.
Admission to NFSU Delhi Campus depends on several factors, including your JEE Main rank, category, home state status, preferred B.Tech programme, seat availability, and the counselling cut-offs for each round. Please share your JEE Main CRL rank, EWS rank, home state, and preferred B.Tech
Among top 100 Universities Globally in the Times Higher Education (THE) Interdisciplinary Science Rankings 2026
Last Date to Apply: 31st July | Ranked #43 among Engineering colleges in India by NIRF | Get Upto 100% Scholarships | Spot Admissions via CUET
100+ Recruiters | 1200+ Placements of 2026 Batch | NBA & NAAC Accredited | Highest CTC 37 LPA
NAAC A+ Grade | Ranked 503 Globally (QS World University Rankings 2026)
40 LPA Highest Package | Up to 100% Scholarship worth 24 Crore via GUTS exam
UGC Approved | Highest Package: ₹1.2 Crore Offered | 20,000+ Placements | 1,800+ Recruiting Partners | Avail Upto 100% Scholarship