Shoolini University Admissions 2026
NAAC A+ Grade | Ranked 503 Globally (QS World University Rankings 2026)


Overall under 82 per cent BTech graduates from the second generation Indian Institutes of Technology (IIT) are placed each year. While under 14 per cent go for further studies, an analysis of government data available through National Institutional Ranking Framework (NIRF 2023) shows this is quite an impressive trend compared to the previous years.
Till 2001, India had just seven IITs — the nation’s premier engineering colleges funded by the central government. Starting from 2008 to 2016, another 14 IITs were established and two existing engineering colleges, Banaras Hindu University (BHU) and Indian School of Mines (ISM) Dhanbad, were granted the status of IITs.
Among the 16 new IITs thus formed, eight of them were established between 2008 and 2009 and known as second generation IITs.
Careers360 studied ranking data over seven years, 2016-17 to 2021-22, of the second generation IITs to see how they fared on placements. The data for the latest year was compared with that of the oldest IITs — Bombay, Delhi, Kharagpur, Kanpur, Madras, Roorkee, Guwahati —to see how the two groups fared.
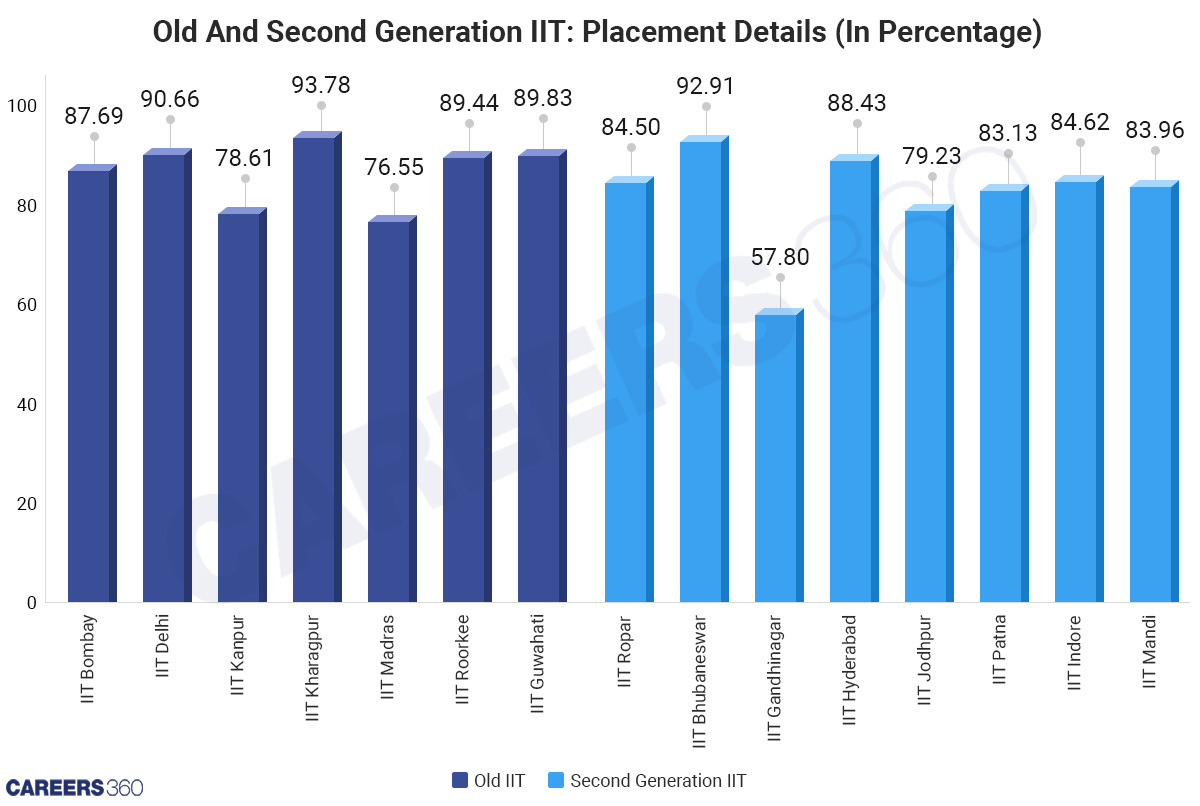
On average, under 82 per cent of the students got placed and over 12 per cent of the students went for higher studies from the eight second generation IITs in 2021-22. The NIRF data does not say anything about what became of the roughly six per cent of students who were neither placed nor enrolled in higher studies. Maybe some of these student can established their own startups.
Over the seven years, the eight colleges experienced fluctuating placement records with the percentage of students placed highest in NIRF 2023.
New IIT Placements: Graduating BTechs Placed (In %)
NAME | 2021-22 | 2020-21 | 2019-20 | 2018-19 | 2017-18 | 2016-17 | 2015-16 |
IIT Ropar | 84.50 | 74.26 | 80.31 | 71.70 | 76.29 | 74.07 | 69.61 |
IIT Bhubaneswar | 92.91 | 81.82 | 80.00 | 81.08 | 82.28 | 76.43 | 82.86 |
IIT Gandhinagar | 57.80 | 68.99 | 52.56 | 48.33 | 52.94 | 60.71 | 60.95 |
IIT Hyderabad | 88.43 | 67.77 | 65.75 | 64.92 | 58.67 | 70.31 | 83.78 |
IIT Jodhpur | 79.23 | 74.85 | 67.86 | 65.09 | 66.39 | 43.23 | 75.00 |
IIT Patna | 83.13 | 90.32 | 61.78 | 61.29 | 73.10 | 64.00 | 85.84 |
IIT Indore | 84.62 | 64.26 | 60.18 | 72.55 | 68.47 | 49.57 | 74.11 |
IIT Mandi | 83.96 | 78.32 | 69.66 | 66.41 | 78.18 | 69.30 | 77.68 |
Also Read | Top NITs: Women’s Presence In The Best NITs Has Declined Over Seven Years
In 2021-22, the oldest IITs, which are also the top-ranked IITs on the NIRF, together averaged a placement percentage of 86.65 per cent.
Although the average placement percentage of second generation IITs have less placement performance figures compared to the top IITs. IIT Bhubaneswar has a higher placement percentage than all top IITs except Kharagpur. While IIT Hyderabad have performed better than IIT Bombay, Madras and Kanpur.
Placement data is present in all NIRF submissions but no score weightage was assigned to it.
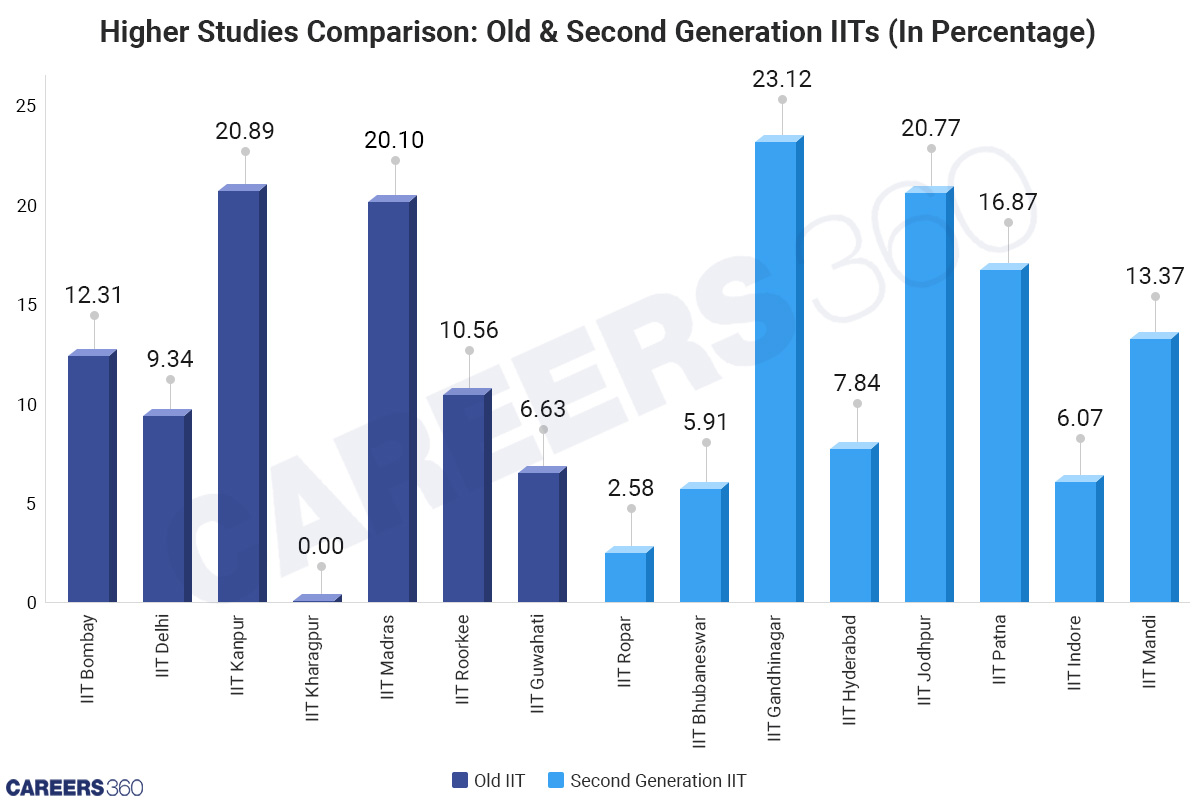
The higher studies graph shows very fluctuating data for all eight engineering institutes. The change in just one year can be as high as more than 10 percentage points.
IIT Students Opting For Higher Studies (In %)
NAME | 2021-22 | 2020-21 | 2019-20 | 2018-19 | 2017-18 | 2016-17 | 2015-16 |
IIT Ropar | 2.58 | 3.80 | 3.15 | 23.58 | 6.19 | 4.63 | 5.88 |
IIT Bhubaneswar | 5.91 | 7.02 | 2.05 | 7.43 | 10.13 | 11.43 | 7.62 |
IIT Gandhinagar | 23.12 | 12.66 | 23.72 | 17.50 | 29.41 | 9.82 | 13.33 |
IIT Hyderabad | 7.84 | 4.40 | 20.09 | 20.94 | 30.10 | 19.79 | 15.68 |
IIT Jodhpur | 20.77 | 23.98 | 1.79 | 4.72 | 6.72 | 18.06 | 7.50 |
IIT Patna | 16.87 | 3.23 | 4.19 | 3.76 | 9.36 | 9.14 | 10.62 |
IIT Indore | 6.07 | 4.26 | 8.41 | 14.71 | 13.51 | 17.39 | 11.61 |
IIT Mandi | 13.37 | 18.88 | 15.86 | 13.28 | 2.73 | 2.63 | 4.46 |
At first generation IITs, an average of 11.4 per cent of students go for further studies after a four-year undergraduate BTech programme. While the ones established in 2008 or 2009 that are considered here, average of about 12 per cent students opt for higher education.
Two of the oldest and most well established, IIT Madras and IIT Kanpur– ranked one and fourth respectively in the NIRF 2023– had the lowest percentage of placements because a large chunk of the student group opted for higher studies.
The percentage of students opting for higher studies in IIT Hyderabad was above 20 per cent for four years till NIRF 2021, but in 2022 NIRF the percentage dropped significantly to 4.4 per cent, even when the placement percentage did not show any major changes. But in the latest years its performance has improved a bit in percentage of students opting for higher studies but major improvement was seen in placement.
 Higher Study: Details
Also Read | 76.8% IIT, 85.5% NIT Students Joined JEE Coaching In Class 11 Or Later: Survey
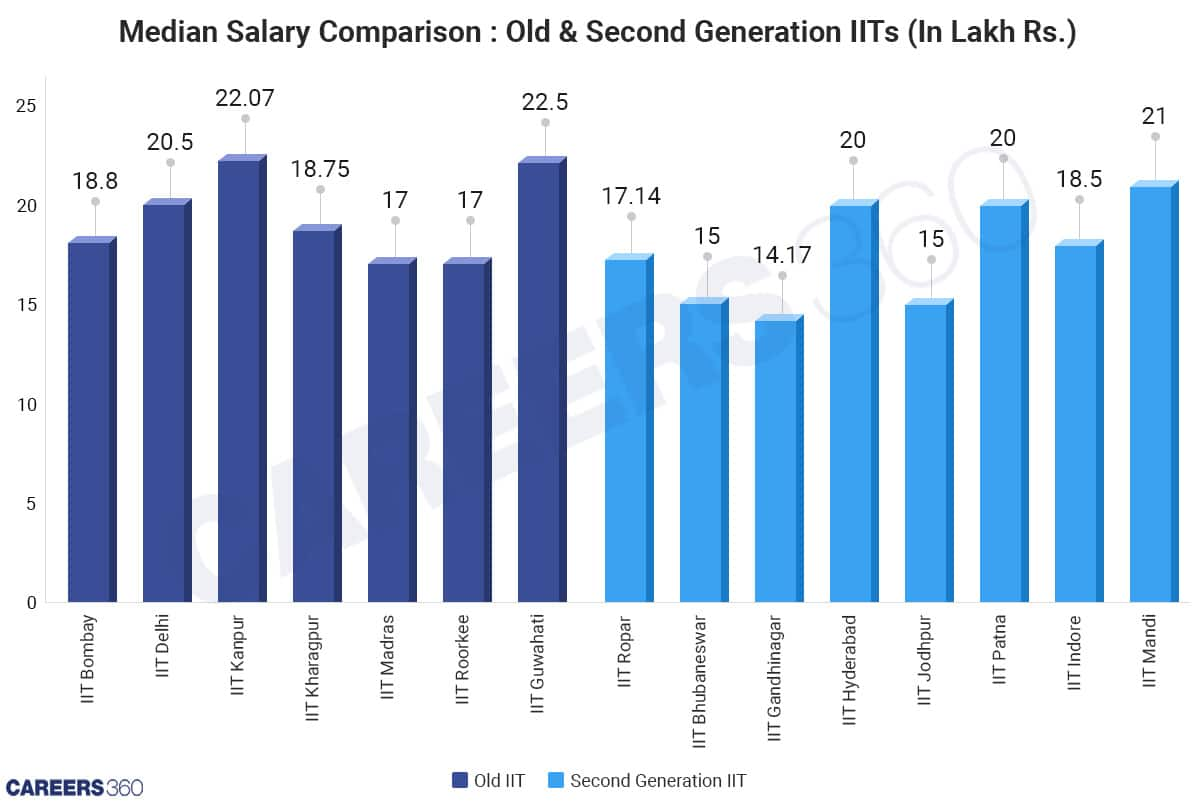
IIT Gandhinagar had the lowest placement percentage as well as the lowest median salary over the last seven academic years among all the IITs. But in 2020-21, its placement percentage improved by a huge margin of 16.4 percentage points compared to the 2019-20 but again remained the lowest in the latest years.
IIT Placement: Median Salary Per Annum (In Rs Lakh)
NAME | 2021-22 | 2020-21 | 2019-20 | 2018-19 | 2017-18 | 2016-17 | 2015-16 |
IIT Ropar | 17.14 | 12.4 | 12.2 | 11.2 | 9.6 | 8 | 8.2 |
IIT Bhubaneswar | 15 | 13.5 | 13.5 | 9 | 8.8 | 7.5 | 6.5 |
IIT Gandhinagar | 14.17 | 9 | 8.97 | 7.25 | 6.63 | 7.08 | 7.5 |
IIT Hyderabad | 20 | 16.25 | 17 | 12 | 10.3 | 9.1 | 7.2 |
IIT Jodhpur | 15 | 12 | 12.25 | 9.37 | 9.25 | 7.75 | 8.2 |
IIT Patna | 20 | 11.8 | 14 | 10 | 10 | 8.88 | 8.52 |
IIT Indore | 18.5 | 14 | 16.5 | 13 | 10 | 10 | 9 |
IIT Mandi | 21 | 18 | 15 | 10 | 9.5 | 10 | 9 |
Almost all the IITs were able to reach a seven-figure annual median salary. The median salary at IIT Mandi, Hyderabad and Patna was more than that of IIT Bombay, Kharagpur, Madras and Roorkee.
 Median Salary Details
Most of the second generation IITs are doing very well when compared to the first generation IITs in terms of placement. As for the students opting for higher studies no trend was seen in comparison among the two sets of IITs. But the median salary offered to their students showed the major difference among these IITs.
Also Check- New IIMs Place Nearly All MBA Graduates But At Half The Average Salary Of Old Ones

Among top 100 Universities Globally in the Times Higher Education (THE) Interdisciplinary Science Rankings 2026
Among top 100 Universities Globally in the Times Higher Education (THE) Interdisciplinary Science Rankings 2026
Last Date to Apply: 31st July | Ranked #43 among Engineering colleges in India by NIRF | Get Upto 100% Scholarships | Spot Admissions via CUET
100+ Recruiters | 1200+ Placements of 2026 Batch | NBA & NAAC Accredited | Highest CTC 37 LPA
NAAC A+ Accredited | Highest CTC 45 LPA | Scholarships Available
NAAC A+ Accredited | Highest CTC 45 LPA | Scholarships Available