Search Colleges, Exams, Schools & more


Login
To Determine Angle Of Minimum Deviation For A Given Prism By Plotting A Graph Between Angle Of Incidence And The Angle Of Deviation. - Practice Questions & MCQ
Edited By admin | Updated on Sep 18, 2023 18:34 AM | #JEE Main
Quick Facts
-

8 Questions around this concept.
Solve by difficulty
 EASY
EASYWhich of the following graphs represents the angle of deviation vs angle of incidence (i) for light ray going from rarer to denser?
The expected graphical representation of the variation of the angle of deviation '$\delta$' with the angle of incidence 'i' in a prism is :
Which graph is correct for the angle of deviation $\delta$ & angle of the incident (i) for a prism?
JEE Main 2026 Session 2: Result Link | Final Answer Key
JEE Main 2026: College Predictor | Official Question Papers
Comprehensive Guide: IIT's | NIT's | IIIT's | Foreign Universities in India
Don't Miss: India's Best B.Tech Counsellors in your city - Book Your Seat
Concepts Covered - 1
To determine angle of minimum deviation for a given prism by plotting a graph between angle of incidence and the angle of deviation.
Aim-
To determine angle of minimum deviation for a given prism by plotting a graph between angle of incidence
and the angle of deviation.
Apparatus-
Drawing board, a white sheet of paper, prism, drawing pins, pencil, half-metre scale, office pins, graph paper
and a protractor.
Theory-
The refractive index in n of the material of the prism is given by
$$
n=\frac{\sin \left(\frac{A+D_m}{2}\right)}{\sin \left(\frac{A}{2}\right)}
$$
where, $\mathrm{D}_{\mathrm{m}}$ angle of minimum deviation and A angle of the prism.
Diagram-
Procedure-
1. Fix a white sheet of paper on the drawing board with the help of drawing pins or tape.
2. Draw a straight line XX' parallel to the length of the paper nearly in the middle of the paper.
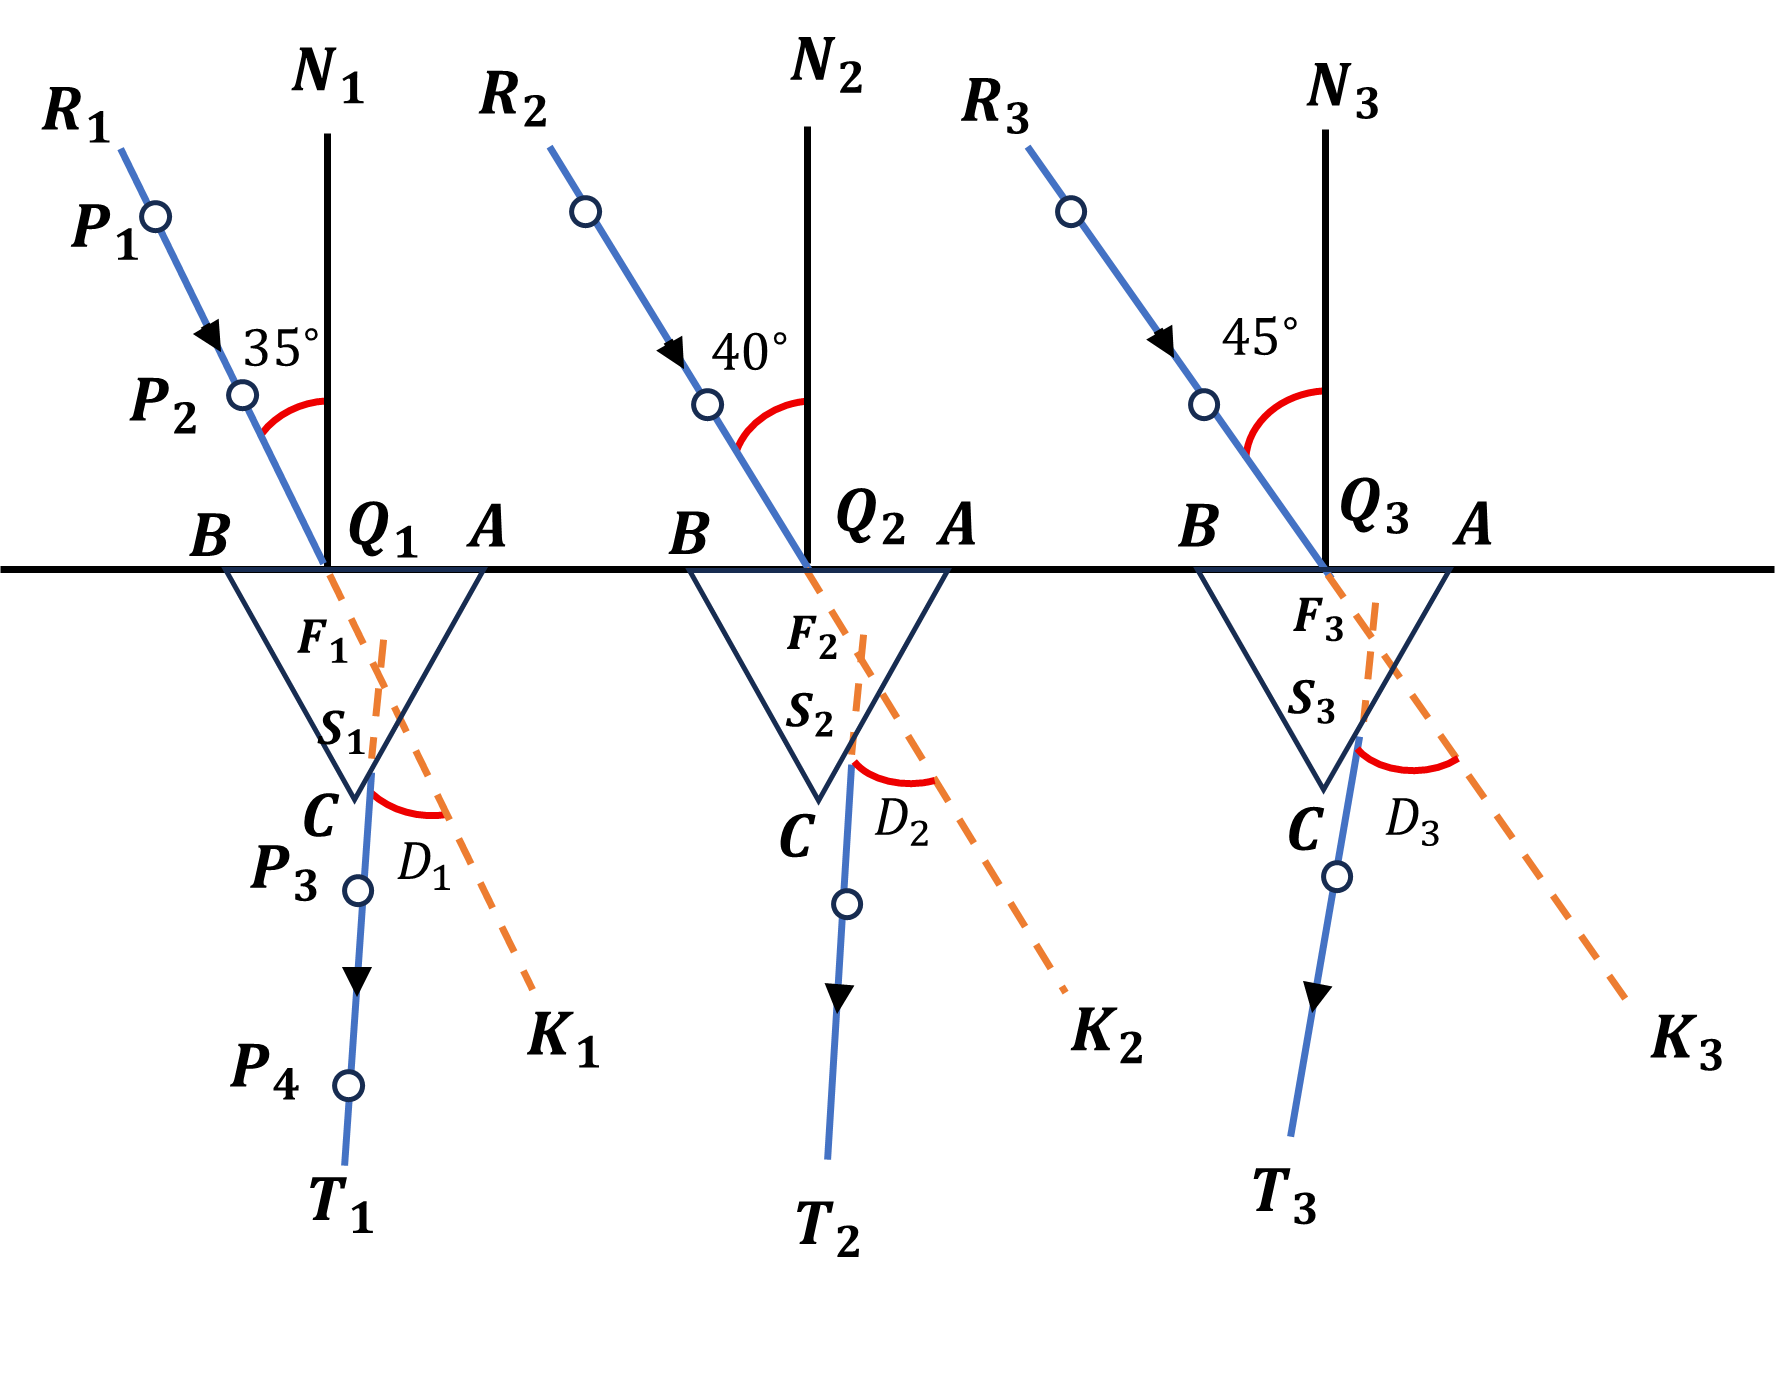
3. Mark points $\mathrm{Q}_1, \mathrm{Q}_2, \mathrm{Q}_3, \cdots$ on the straight line XX ' at suitable distances of about 5 cm .
4. Draw normals $N_1 Q_1, N_2 Q_2, N_3 Q_3, \cdots$ on points $Q_1, Q_2, Q_3, \ldots$ as shown in diagram.
5. Draw straight lines $R_1 \mathrm{Q}_1, \mathrm{R}_2 \mathrm{Q}_2, \mathrm{R}_3 \mathrm{Q}_3, \ldots$ making angles of $35^{\circ}, 40^{\circ}, \ldots 60^{\circ}$ (write value of the angles on the paper) respectively with the normals.
6. Mark one corner of the prism as $A$ and take it as the edge of the prism for all the observations.
7. Put it prism with its refracting face $A B$ in the line $X X^{\prime}$ and point $Q_1$ in the middle of $A B$.
8. Mark the boundary of the prism.
9. Fix two or more office pin $\mathrm{P}_1$ and $\mathrm{P}_2$ vertically on the line $\mathrm{R}_1 \mathrm{Q}_1 \mathrm{P}_1$ and $\mathrm{P}_2$ vertically on the line $\mathrm{R}_1 \mathrm{Q}_{1 \text { The distance between the pins should }}$ be 10 mm or more.
10. Look the images of point $\mathrm{P}_1$ and $\mathrm{P}_2$ through face AC .
11. Close your left eye and bring open right eye in line with the two images.
12. Fix two office pins $P_3$ and $P_4$ vertically, and 10 cm apart such that the open right eye sees pins $P_4$ and $P_3$ and images of $P_2$ and $P_1$ in one straight line.
13. Remove pins $P_3$ and $P_4$ and encircle their pricks on the paper.
14. Repeat steps 7 to 13 with points $Q_2, Q_3, \ldots$ for $i=40^{\circ}, \ldots, 60^{\circ}$.
To measure D in different cases
15. Draw straight lines through points $P_3$ and $P_4$ \{pin pricks) to obtain emergent rays $\mathrm{S}_1 \mathrm{~T}_1, \mathrm{~S}_2 \mathrm{~T}_2, \mathrm{~S}_3 \mathrm{~T}_3 \ldots \ldots$
16. Produce $T_1 \mathrm{~S}_1, \mathrm{~T}_2 \mathrm{~S}_2, \mathrm{~T}_3 \mathrm{~S}_3, \ldots$ inward in the boundary of the prism to meet produced incident rays $\mathrm{R}_1 \mathrm{Q}_1$,
$\mathrm{R}_2 \mathrm{Q}_2, \mathrm{R}_3 \mathrm{Q}_3, \cdots$ at points $\mathrm{F}_1, \mathrm{~F}_2, \mathrm{~F}_3, \cdots$
17. Measure angles $\mathrm{K}_1 \mathrm{~F}_1 \mathrm{~S}_1, \mathrm{~K}_2 \mathrm{~F}_2 \mathrm{~S}_2, \mathrm{~K}_3 \mathrm{~F}_3 S_3, \ldots \ldots$.
These give angle of deviation $\mathrm{D}_1, \mathrm{D}_2, \mathrm{D}_3, \ldots$
18. Write values of these angles on the paper.
To measure A
19. Measure angle BAC in the boundary of the prism. This gives angle A.
20. Record your observations.
Calculation:
Plot a graph between angle of incidence $\angle i$ and angle of deviation $\angle D$ by taking $\angle i$ along X -axis and $\angle D$ Y -axis. From this graph, find the value of a single minimum deviation $\mathrm{D}_{\mathrm{m}}$ corresponding to the lowest point of the graph.
Let the value of angle of minimum deviation, $D_m=\ldots$.
Then
$$
n=\frac{\sin \frac{A+D_m}{2}}{\sin A / 2}
$$
Result
1. i-D graph indicates that as the angle of incidence (i) increases, the angle of deviation (D) first decreases, attains a minimum value $\left(D_m\right)$ and then starts increasing for further increase in angle of incidence.
2. Angle of minimum deviation, $D_m=\ldots \ldots$.
3. Refractive index of the material of the prism, $n=\ldots \ldots$.
"Stay in the loop. Receive exam news, study resources, and expert advice!"
Get Answer to all your questions
B.Tech/B.Arch Admissions OPEN
Among top 100 Universities Globally in the Times Higher Education (THE) Interdisciplinary Science Rankings 2026
UPES B.Tech Admissions 2026
ApplyLast Date to Apply: 30th May | Ranked #43 among Engineering colleges in India by NIRF | Highest Package 1.3 CR , 100% Placements
Amrita University B.Tech 2026
ApplyRecognized as Institute of Eminence by Govt. of India | NAAC ‘A++’ Grade | Upto 75% Scholarships | Only JEE Scores Accepted
Shoolini University Admissions 2026
ApplyNAAC A+ Grade | Ranked 503 Globally (QS World University Rankings 2026)
Manav Rachna-B.Tech Admissions 2026
ApplyNAAC A++ Grade | Recognized as Category-1 Deemed to be University by UGC | 41,000 + Alumni Imprints Globally
Quantum University Admissions 2026
Apply33.5 LPA-Highest Package | Up to 100% scholarship worth 30 CR